 |
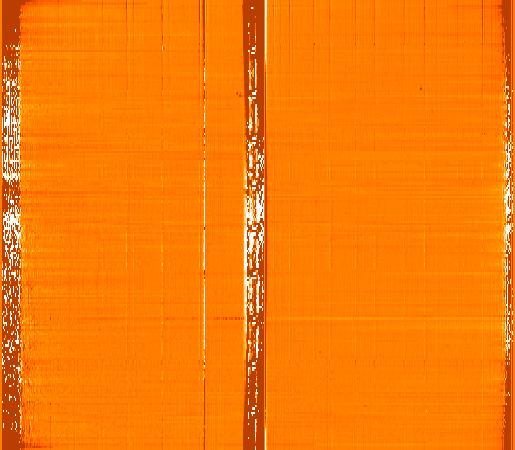
display range: 0,2
- Adjust the x-shift of irs1_flat_lra.fits
using bright star spectra in irs1_sample1_lrypb.fits
- Mormalize the total flux of each spectra
in the shifted flat image
- Mormalize the average flux at each wavelength
in the above image
- Magnify along y-axis with a factor of 9
|

 irs1_flat_sample1_lra.fits

 irs1_flat_sample1_lra.fits
