3. Science Cases
Kyoto3DII is a powerful instrument for investigating the physical properties of spatially extended objects.
Thus, the main targets of Kyoto3DII are nearby galaxies.
The followings are the main results by Kyoto3DII.
Galactic scale outflows (galactic winds) are consider to affect the star-formation activities and metal enrichment of intergalactic medium.
We observed an active galactic nucleus of an elliptical galaxy NGC 1052 with Kyoto3DII IFS mode, and have revealed a high velocity bipolar outflow and its detailed structures.
Figure 3-1 shows velocity channel maps of an emission line from twice ionized oxygen.
Left, middle, and right panels display the distribution of gas moving toward us at 800 km/s, not moving along the line of sight, and moving away from us at 400 km/s, respectively.
Some outflow gas has a large velocity, more than 1000 km/s.
This observation enables us to reveal the detail structure of the NGC 1052 outflows.
Figure 3-1: Oxygen emission line intensity maps of the center of NGC 1052 obtained by Kyoto3DII IFS mode.
North is up and east is to the left.
Field of view of each image is about 3 arcseconds, which corresponds to about 900 light-year.
# Reference
A massive object, such as a galaxy cluster and a black hole, between a distant object and us works like an optical lens.
The lensing effect can magnify and distort the image of the background source.
On the other hand, magnified and distorted images of the lensed object tell us about the lensing object.
Lensing and lensed objects are usually a galaxy cluster and a quasi-stellar object (quasar).
However, a quadruply lensed quasar 1RXS J1131-1231 shows anomalous flux ratios between the lensed images, which indicates the presence of a substructure at a lensing object other than a galaxy cluster.
The possible substructure is a dark matter clump and a normal star.
In order to reveal what is the substructure, we carried out an IFS observation for 1RXS J1131-1231.
The brightness of image C in the oxygen emission line is the same as that expected from the gravitational lensing model with only a galaxy cluster for the lensing object, while image C is darker than the model in hydrogen map.
This fact indicates that the mass of this substructure is smaller than 105 Msun, and thus, unfortunately, it is not a dark matter clump but a star.
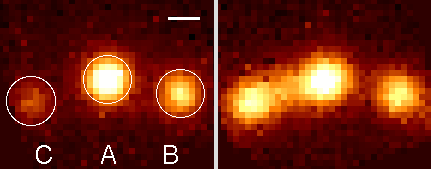
Figure 3-2: Emission line intensity maps of three lensed images out of a quadruply lensed quasar 1RXS J1131-1231 obtained by Kyoto3DII IFS mode.
Left and right panels display emission from hydrogen and oxygen, respectively.
The white bar at the upper right in the left panel displays the length of 0.5 arcsecond.
# Reference
Galactic winds are occurred by kinetic energy input from many supernovae in the center of starburst galaxies.
Because they are diffuse, i.e., extended and small emission line intensity, it is difficult to investigate galactic winds in detail.
Galactic winds in one of the nearest starburst galaxy NGC 253 provide us an opportunity to investigate the physical properties because of its proximity.
In order to investigate the dominant ionization source of NGC 253 galactic winds, we obtained deep emission line maps with Kyto3DII Fabry-Perot mode.
The observed nitrogen/hydrogen flux ratios at the outer galactic wind regions are larger than 1, which indicates that the dominant ionization source is shock.
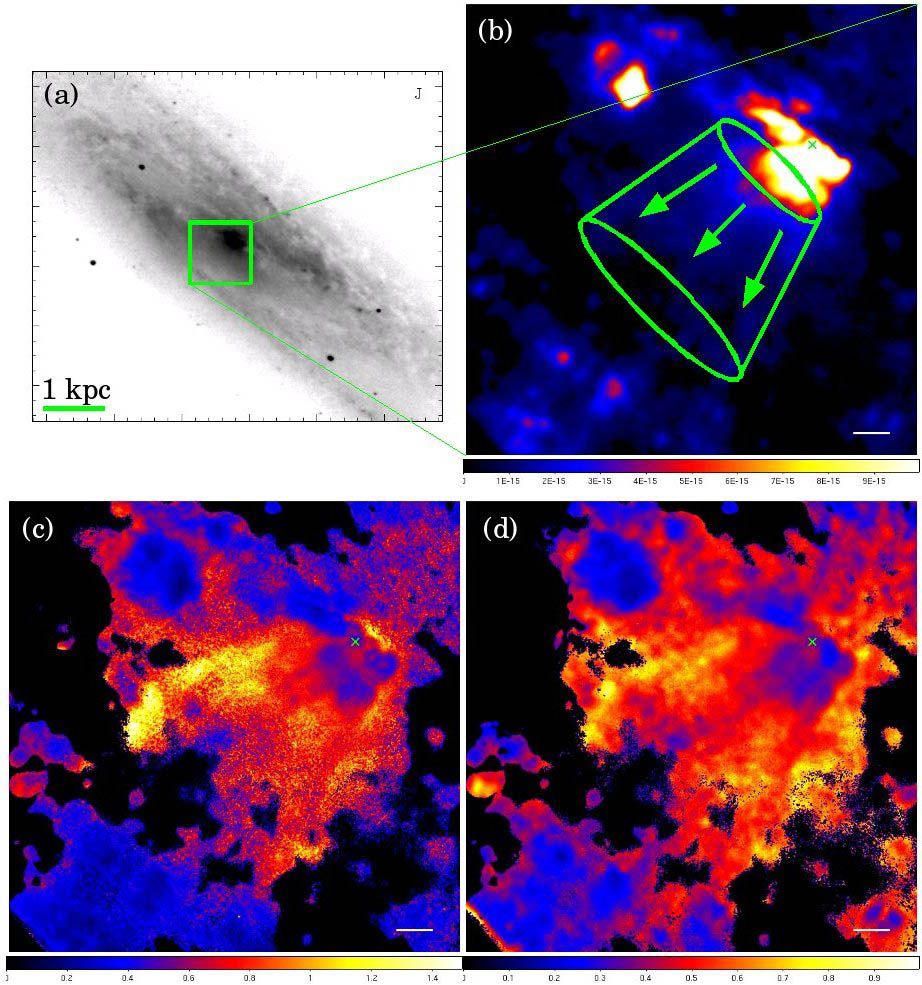
Figure 3-3: Images of a nearby starburst galaxy NGC 253.
(a) J-band image (Engelbracht et al. 1998, ApJ, 505, 639-658).
The bar at the lower left represents the length of 1 kpc.
The green square represents the site of panels (b), (c), and (d).
(b) Hydrogen intensity map of the central region of NGC 253.
The truncated cone represents the position of the galactic wind.
Arrows in the cone represent the direction in which the galactic wind is blowing.
(c) Nitrogen/hydrogen and (d) sulfur/hydrogen flux ratio maps of the central region of NGC 253.
The green crosses at the centers represent the centers of NGC 253, while white bars at the lower right represent the length of 100 pc.
(Credit: NAOJ)
# Link
# Reference